
A basis-point framework for what a 30+ day furnished insurance placement should cost, and where the current market structure adds premium it shouldn't.
A companion white paper to the four-part series "What's actually happening in midterm housing." Part 2 traced how every era of this industry added a layer between the buyer and the person who holds the keys. Part 3 showed what those layers do to a nightly rate. This paper does the same work from the other direction: it starts from first principles (the risk-free rate every asset in the economy is priced against) and builds up what a 30+ day furnished insurance placement should cost, component by component. Then it compares that to what the current market structure actually produces.
If you only have five minutes, read the bold sentences and the two tables. They carry the whole argument.
A furnished insurance placement should cost what a long-term rental costs, plus premiums for the real costs the placement adds: furnishing the unit, bundling utilities, accepting a shorter term, and managing a more operationally complex booking. In our estimate those premiums total roughly 250–350 basis points of yield. Everything above that is structure, not service. And structure can be removed.
That is the entire paper in four sentences. The rest of it shows the work, names each component, and is honest about which numbers we know and which we are estimating.
We believe furnished insurance housing is priced hundreds of basis points above where its real costs justify, though the mechanics behind that gap are the same ones that have priced every intermediated market for as long as intermediated markets have existed. We came to this view the slow way: operating across the short-term, mid-term, and long-term rental investment industries, and through many conversations with the landlords, property managers, and housing professionals who move displaced families every day.
The claim that intermediaries mark up housing is not new; we made it, with a concrete example, in Part 3 of the series. What that example lacked was a framework: a way to separate the part of a furnished rate that is earned from the part that is structural. This paper is that framework. We are publishing it so it can be stress-tested, not because we believe every number in it is exact. Where a figure is an estimate, we say so. Where we can't quantify something yet, we say that too.
One definition before we start, because we will use the unit throughout: a basis point (bp) is one hundredth of one percent. One hundred basis points is 1.00%. Investors quote yield differences in basis points for the same reason carpenters measure in sixteenths: the differences that matter are small, and they add up.
Let's start with the timeless fundamentals of how rental property is priced.
Every yield in the economy is built on the risk-free rate: what the U.S. government pays to borrow. As of this writing (July 2026), the 10-year Treasury yields roughly 4.5%. That number will drift; the structure built on top of it will not, which is why this framework survives the number changing. Substitute whatever the 10-year yields when you read this.
A single-family investor who rents a property on a traditional 12-month unfurnished lease earns a long-term rental cap rate: the property's annual net operating income as a percentage of its value. By definition it sits above the risk-free rate, because a tenant is riskier than the Treasury and a roof needs repairs. That cap rate, whatever it is in your market, is the baseline of this framework. It is the minimum return required to hold the asset at all. Everything a furnished 30+ day placement pays above it needs a reason.
As a principle: every basis point of premium above the long-term baseline should trace to a cost someone actually bears. A premium that traces to a cost is a price. A premium that doesn't is a toll.
So what does a furnished insurance placement actually add to the owner's costs? Four things, each nameable, each deserving a premium. We estimate each in basis points of yield on the asset. These ranges are our estimates from operating experience and market conversations. They are illustrative, not a published statistic and not a rate card. If your numbers differ, the framework still works; plug in your own.
| # | Component | Why it's earned | Our estimate |
|---|---|---|---|
| 1 | Furnishing amortization | Furniture, housewares, and linens are capital that depreciates and must be replaced | +75–100 bps |
| 2 | Utilities (bundled) | The owner carries electric, water, and internet, usage risk included | +50–75 bps |
| 3 | Term premium | Stays under 12 months mean more vacancy risk and more turnovers per year | +75–100 bps |
| 4 | Professional management | Move-in coordination, mid-stay support, extension handling; operationally this is a hospitality product | +50–75 bps |
| Earned subtotal | ~250–350 bps |
As the table shows, a furnished 30+ day placement should run several hundred basis points above a traditional lease, and there is nothing wrong with that. The owner does more work, carries more capital, and takes more risk. The earned premium is the product. A framework that pretended these costs away would just be a lowball.
That brings us to the part of the stack that doesn't trace to a cost.
In today's market, furnished inventory frequently reaches the ultimate payer through a chain that looks like this:
Landlord / property manager → markup layer(s) → insurance housing company → carrier (the claim's payer)
The chain itself is the history of the industry (Part 2 tells that story), and each link in it originally existed for a reason. But two things happen inside this structure that add premium without adding cost.
First: layering markup. Where a unit passes through resellers or sourcing layers before reaching the insurance housing company, each layer prices in its own margin. The clearest documented walk-through of that mechanic comes from the corporate housing supply chain, where a unit offered at ~$140 a night can reach the end buyer at ~$240 (we build that chain layer by layer in our corporate housing companion piece). Insurance placements share the mechanic wherever layers sit in the chain, and they carry a second distortion corporate housing doesn't, which we cover next. In yield terms, we estimate layering adds roughly 100–200 bps where it applies. It does not apply everywhere: in a direct placement this component is zero, and we want to be precise about that rather than paint the whole market with it. But based on our conversations across the industry, it remains a meaningful cost driver in a significant share of placements.
Second: insurance request markup. When a supplier knows the booking is an insurance claim, the quote tends to anchor to the insured's housing allowance rather than to competing inventory. No conspiracy is required; this is what happens in any market where the seller can see the buyer's budget and the buyer can't see the seller's alternatives. It's a game of telephone where the last person to speak knows what's in your wallet. We estimate this behavior adds roughly 50–100 bps where it occurs. (The allowance itself, fair rental value, and the methodologies used to calculate it are their own subject, covered in our fair rental value companion piece.)
Here is the full stack for the current structure:
| Component | Premium |
|---|---|
| Earned subtotal (furnishing, utilities, term, management) | ~250–350 bps |
| Insurance request markup (where it occurs) | +50–100 bps |
| Total - direct placement, no layering | ~325–450 bps |
| Layering markup (where it applies) | +100–200 bps |
| Total - with layering | ~425–650 bps |
We do not know what share of the market these two components touch. Many furnished accommodations book direct today, with no platform and no reseller in the chain. What we can say is this: across many conversations with operators in this space, insurance request markup keeps coming up, not as a secret but as an openly discussed strategy in residential real-estate-investor communities. The incentive structure of the current process, even when it runs through a platform without real-time rates, does not consistently produce the best available rate. We are confident the behavior covers a meaningful portion of the market. We cannot yet tell you the percentage, and we'd rather admit that than invent one.
The industry is not ignoring this. The largest insurance housing companies have made real efforts to address pricing behavior and continue to improve their processes. The problem is structural, not personal: as long as suppliers can see the allowance and can't see each other, the incentive survives every process improvement layered on top of it.
Now change one thing about the chain: connect the landlord and property manager directly to the source of demand.
Landlord / property manager → real-time marketplace → insurance housing company → carrier (the claim's payer)
The professionals stay. The landlords and property managers are still the supply side; the insurance housing company still runs the placement and the carrier relationship. What disappears is the space between them where layering and insurance request markup live.
| Component | Premium |
|---|---|
| Earned subtotal (furnishing, utilities, term, management) | ~250–350 bps |
| 8-11% booking fee (≈ yield impact) | +80-110 bps |
| Layering markup | 0 bps |
| Insurance request markup | 0 bps |
| Rate visibility (real-time competing inventory) | −30–50 bps |
| Expanded landlord supply | −30–50 bps |
| Net total | ~250–350 bps |
On the fee itself: relative to a direct, fee-free placement, the booking fee is an incremental cost. Our expectation (and it is an expectation, stated as one) is that the two compression effects absorb it and more, because as landlords gain direct visibility into insurance demand and compete for placements, risk premiums normalize toward the earned minimum. The marketplace's claim is not "we are free." It's "the structure we remove costs more than the fee we charge."
| Scenario | Premium above long-term rental baseline |
|---|---|
| Current structure - direct, no layering | ~325–450 bps |
| Current structure - with layering | ~425–650 bps |
| Marketplace structure | ~250–350 bps |
| Expected reduction vs. the no-layering case | ~75–100 bps |
| Expected reduction vs. the layered case | ~150–250 bps |
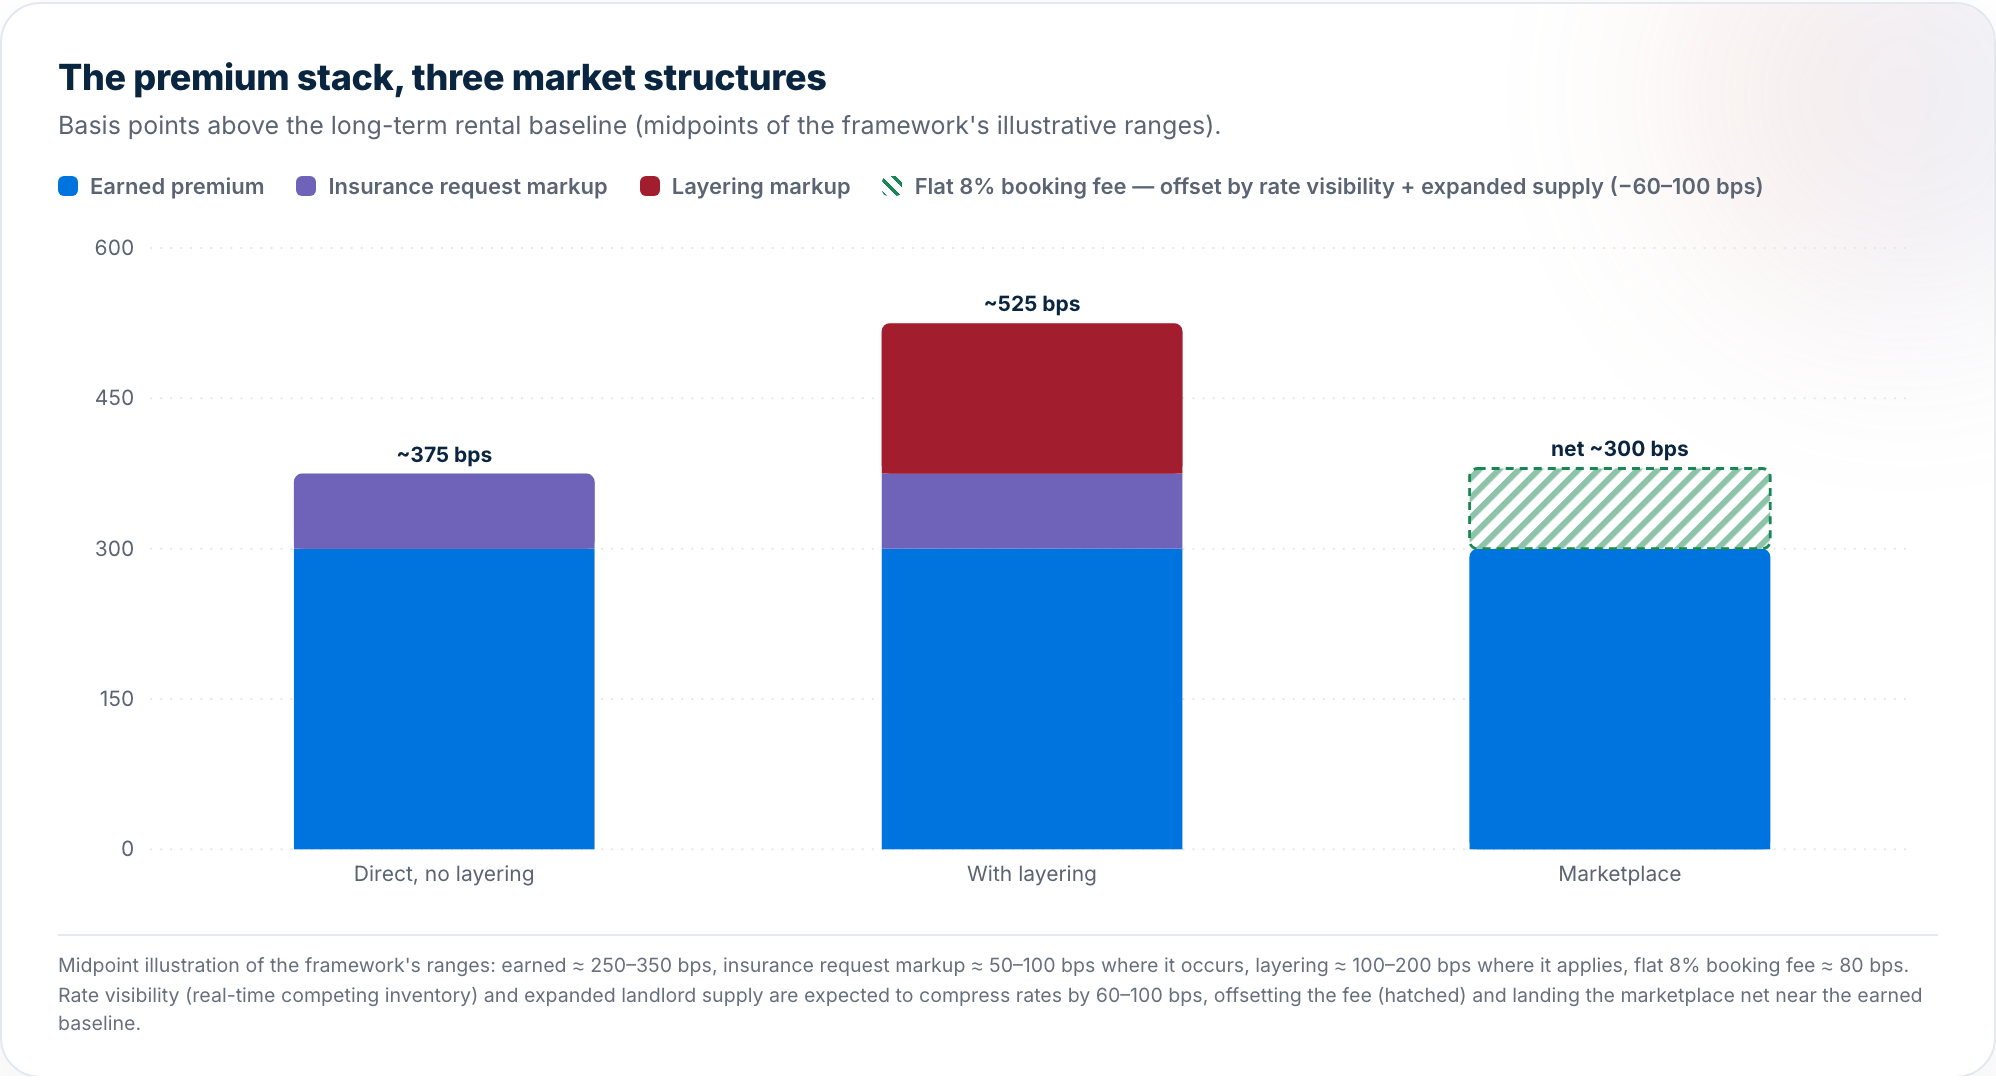
Read the table this way: the two structures share their first four rows entirely. Landlords earn the same furnishing, utility, term, and management premiums in both worlds. The difference is confined to the structural rows. And all of them trace to the same cause: in one structure the person who holds the keys can see the market and be seen by it, and in the other they can't.
While no individual placement goes exactly this way, our experience across the short-term, mid-term, and long-term rental investment industries suggests almost all of them by and large do. These estimates aren't perfect (pricing behavior is unevenly distributed, and much of this market's data is private), but we believe they do an excellent job of painting the big picture. The conviction that this premium can be compressed, and that a real-time marketplace is the mechanism that compresses it, is central to what we are building.
Basis points are precise but abstract, so here is the same framework in monthly dollars. Every number in this example is illustrative: a clean round case, not a quoted rate.
Take a $500,000 single-family home. Two anchors are observable. As a traditional 12-month unfurnished rental it leases for about $2,500 a month (about $82 a night). And a comparable home lists short-term at about $220 a night for a weekend guest. Between those anchors runs the term curve, and in every healthy rental market it slopes one way: committed length buys a discount. A 30-day stay earns roughly 10–20% off the one-night rate (about $180–195 a night); each additional few months of term takes another 3–5% off; and by about a year the discount is exhausted at the curve's floor: the unfurnished lease plus the real costs of delivering furnished (furniture, utilities, service), around $135 a night. On that curve, an honestly priced 60-day placement sits near $175–190 a night. (Net of delivery costs and vacancy between stays, that same curve is the earned 250–350 bps of the framework, expressed in nightly dollars.)
Now look at what the same home can actually quote on an insurance placement today: in this illustrative case, about $240 a night (roughly $7,300 a month). That number doesn't just skip the term discount. It sits above the one-night rate.
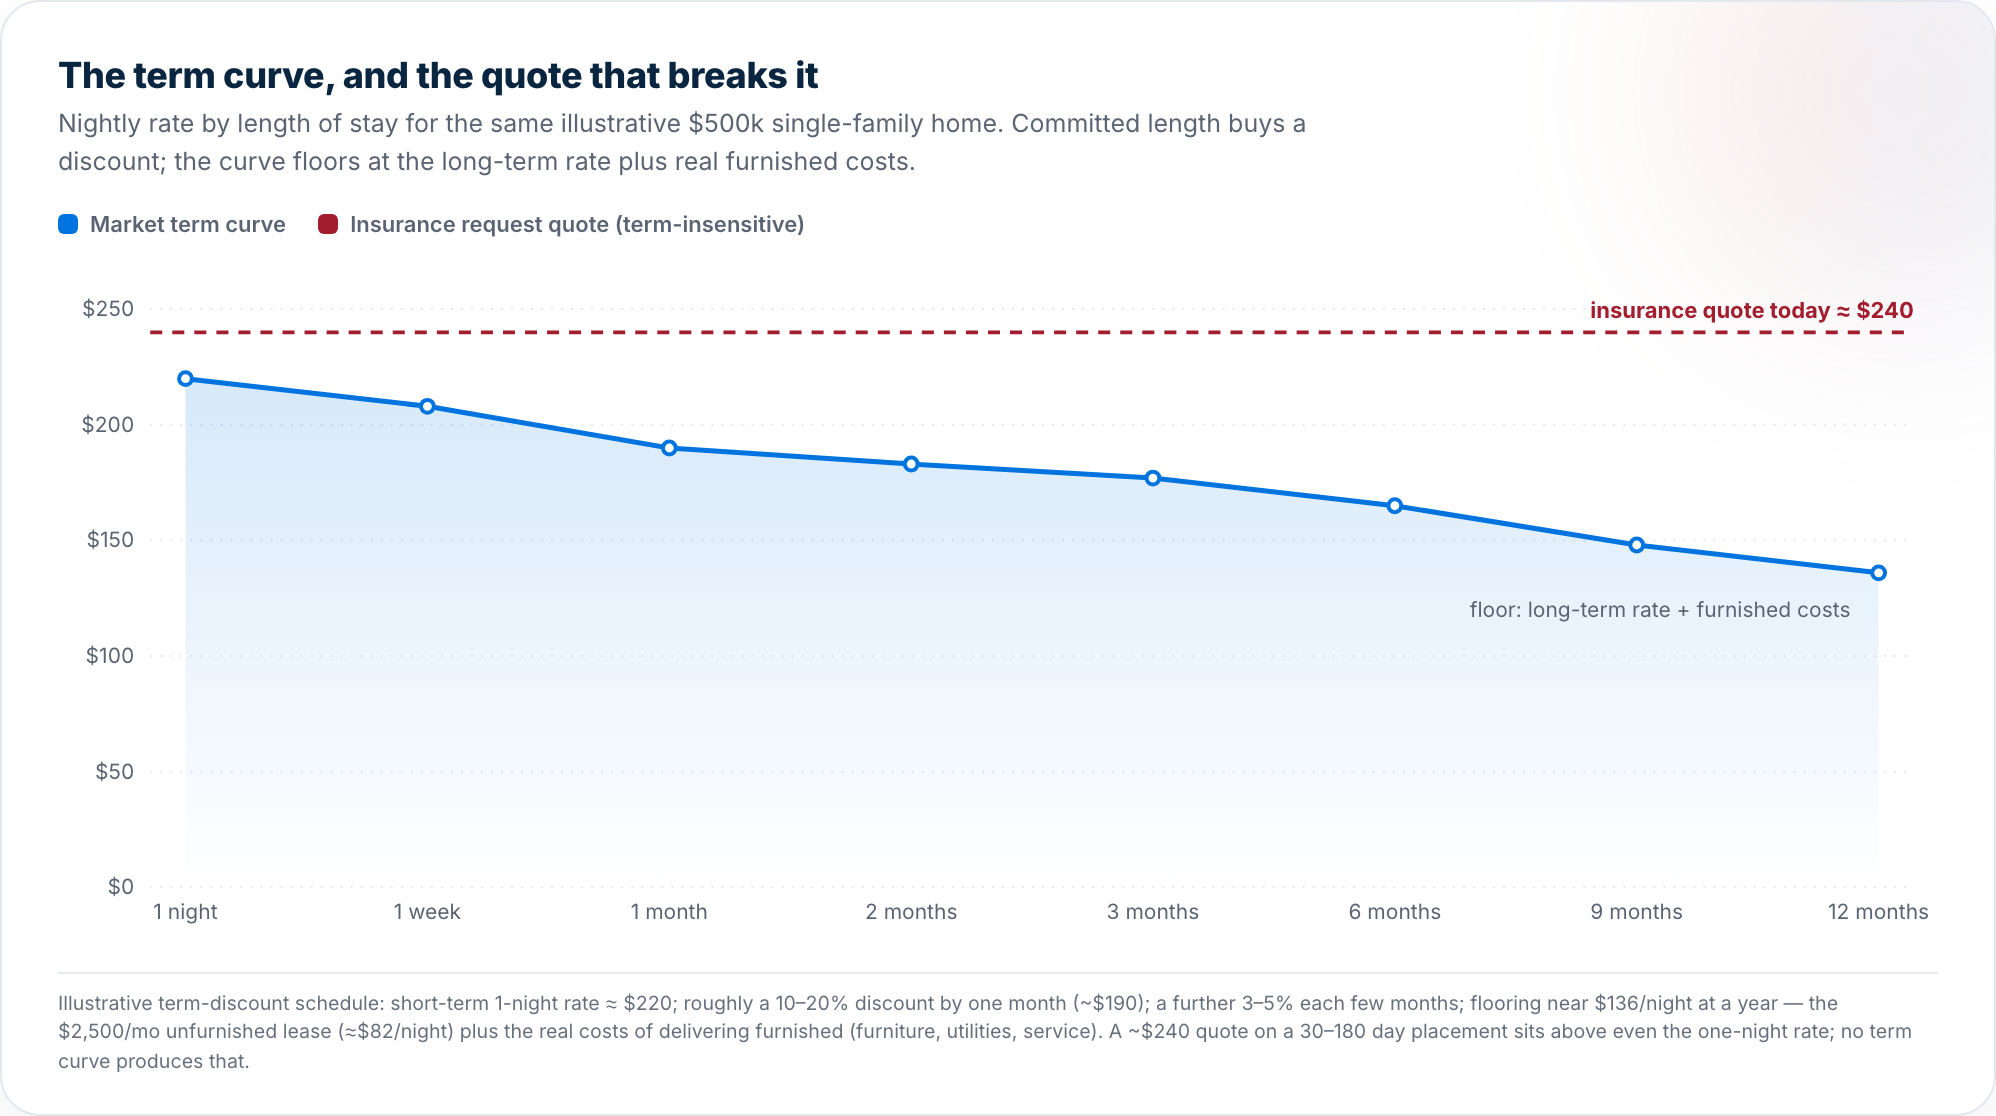
That is an inverted term curve, and it should stop you. In every rental market we know, committed length buys a discount: a 60- or 90-day guaranteed stay should price below a two-night stay per night, because the owner carries less vacancy risk, fewer turnovers, and lower acquisition cost. When a 60-day insurance placement prices above the weekend rate for a comparable home, cost structure cannot explain it. Structure can: the layers between the home and the claim, and a quote anchored to an allowance instead of a market. The inverted term curve is the observable symptom of everything this framework describes.
(A unit note for careful readers: this example is in gross monthly dollars, while the framework above is in net yield. The shapes match; the units differ. Don't try to reconcile them line by line.)
One more distinction keeps this framework honest, because a cap rate is not a total return. The cap rate is today's income: net operating income as a percentage of asset value, a snapshot that assumes nothing changes. The internal rate of return (IRR) is what the investor actually earns over the hold: the income yield plus income growth and price appreciation, realized through the exit. The spread between the two is the growth the investor expects, and the spread between the cap rate and the risk-free rate is the premium for illiquidity and operating risk (Adventures in CRE has a clean walkthrough of these relationships). Everything in this paper prices the income layer. The IRR layer is where the story gets even better for the honest operator.
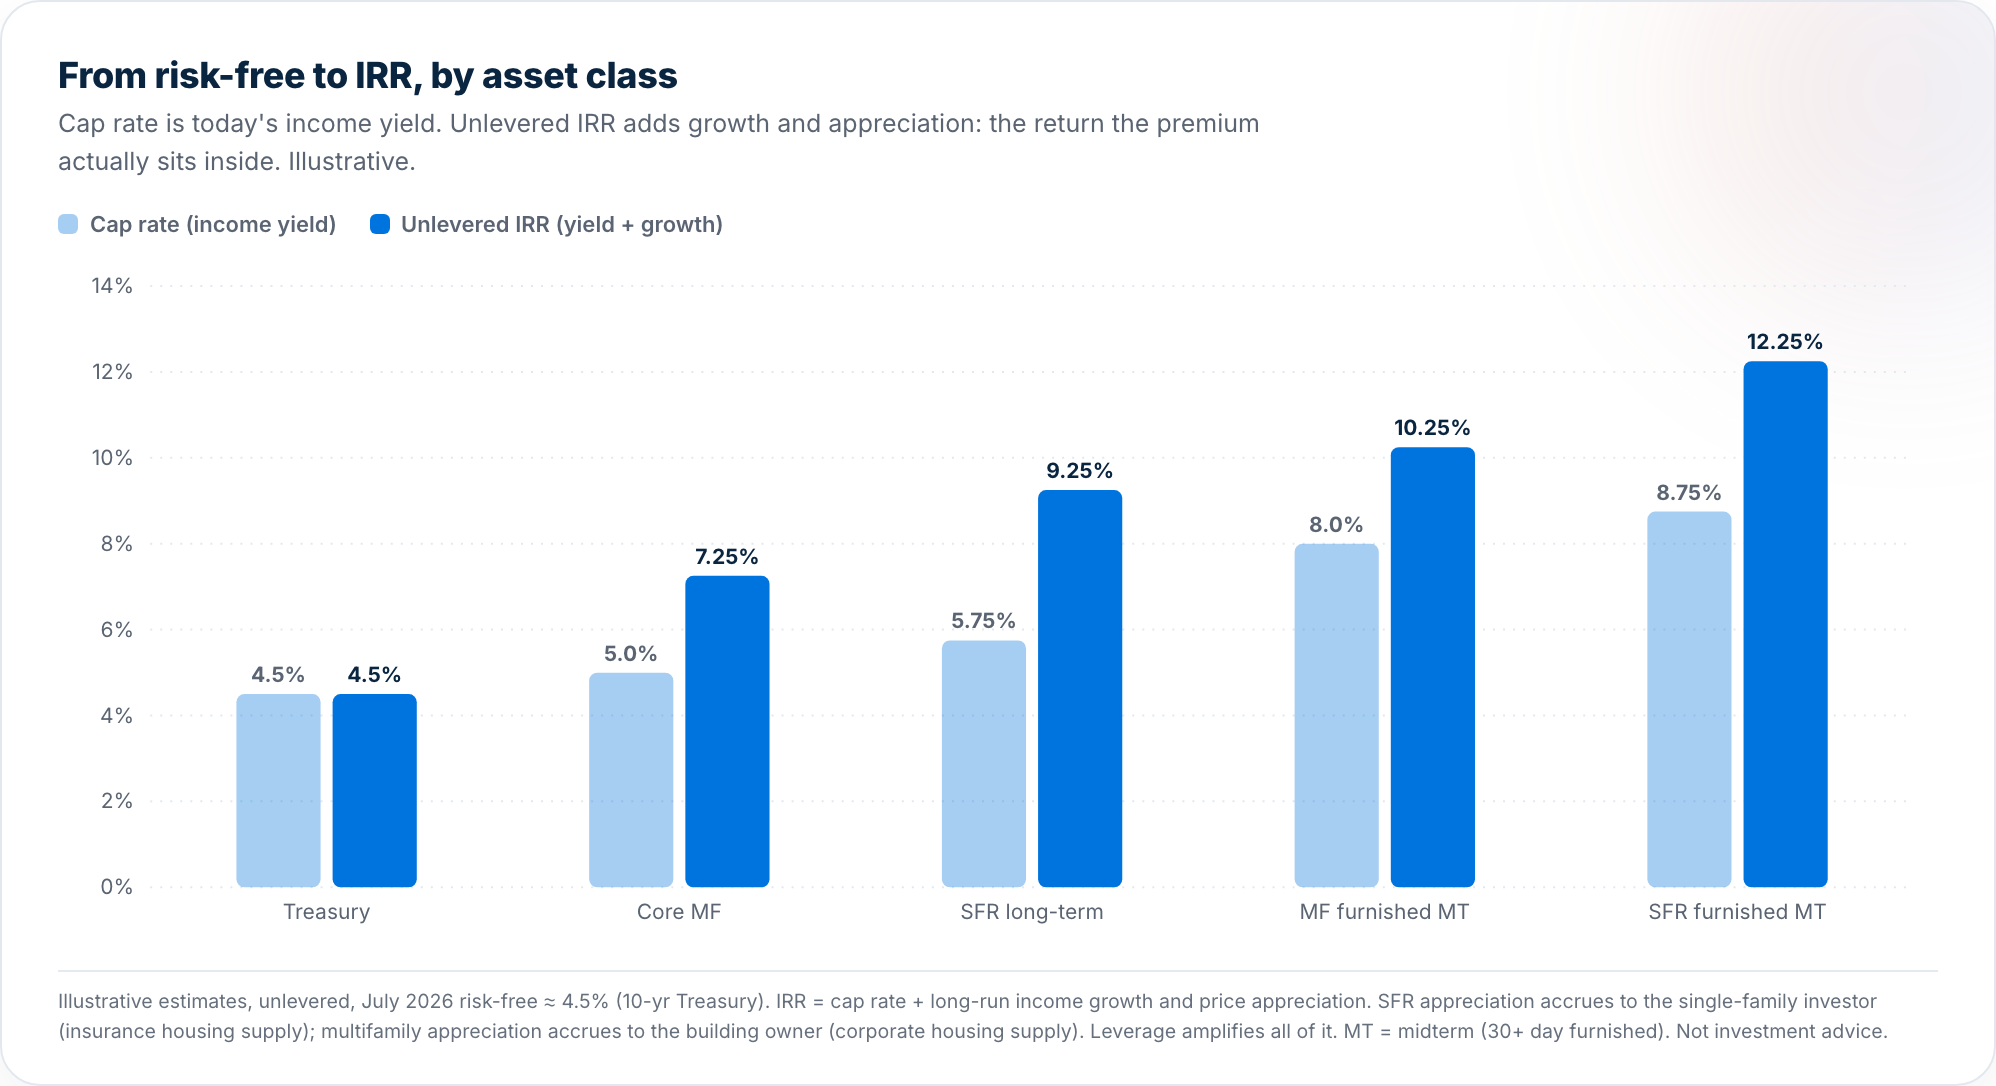
Two things in that chart matter for this market.
Appreciation stacks differently by asset type, and the two housing verticals sit on different assets. Insurance housing supply skews single-family, because a displaced family needs a house. The single-family investor who hosts insurance placements owns the appreciating asset, so long-run price appreciation stacks on top of the furnished yield; the same party earns both. Corporate housing supply skews multifamily, and there the appreciation accrues to the building owner; the corporate housing layers above the building own no asset at all, which is why their earnings are spread, not return (and why that market inflates differently).
The earned premium doesn't need help. At illustrative long-run appreciation assumptions, an honestly priced furnished midterm single-family home already clears a double-digit unlevered IRR, before any leverage and without a single basis point of insurance request markup. That is the quiet, load-bearing conclusion of this whole framework: the honest version of this strategy is already one of the best risk-adjusted returns in residential real estate. Hosts don't need the structural premium. The structure needs them.
What we don't know is much greater than what we know, and this framework is weakest in three places. We can't yet quantify what share of placements carry layering markup, so the two "current structure" rows blend cases that should eventually be separated with data. The two compression estimates (−30–50 bps each) are directional, built on how rate visibility has behaved in other markets rather than measured in this one. And the earned-premium ranges are our estimates, not survey data; a landlord in a high-cost market may reasonably run above them.
We're passing this framework along for you to take or leave, and to stress-test. If you operate in this market and your numbers differ, we want to see them. That is the point of publishing the framework instead of the conclusion.
(For context on who we are: Radius is a real-time marketplace for 30+ day furnished accommodations, serving insurance, corporate, and direct guests, with an 8-11% booking fee deducted from the host's payout. Hosts list live availability at their own rates; companies book directly from the live calendar.)
Why do furnished 30+ day rentals cost more than unfurnished long-term rentals?Because the owner carries additional costs: furniture and housewares that depreciate, bundled utilities, more frequent turnovers on shorter terms, and hands-on management. In this framework those earned costs total roughly 250–350 basis points of yield above the long-term rental baseline. That premium is legitimate. The question is what gets added on top of it.
What is insurance request markup?It's the tendency to quote a rate based on the insured's housing allowance rather than on competing market inventory. It occurs because suppliers can often see the budget while buyers can't see alternatives in real time. It is openly discussed as a strategy in real-estate-investor communities, though its exact market share is not measurable from public data.
Doesn't a marketplace booking fee just replace the markup it removes?The magnitudes differ by case. The 8-11% booking fee is roughly 80-110 basis points in yield terms. In a layered placement, the structure it replaces runs roughly 150–300 basis points, so the removal dominates. In a direct, unlayered placement the swap is closer to a wash before the compression effects of rate visibility and expanded supply, which is why we describe the fee as offset rather than free.
How should a host set rates for insurance placements?Work the term curve. Start from the short-term nightly rate for a comparable home, apply roughly a 10–20% discount by one month and another 3–5% each few months, and check the floor: your long-term rate plus the real costs of delivering furnished. A rate on that curve wins bookings in a market with real-time rate visibility. A rate built from a claim allowance increasingly won't.
What is an inverted term curve in rental pricing?It's when a longer committed stay prices above a shorter one per night, the opposite of how rental markets normally work. A 60-day placement should earn a term discount versus a weekend stay (less vacancy risk, fewer turnovers). When an insurance placement prices above the short-term rate for a comparable home, the difference comes from market structure, not cost.
Is this framework a rate card?No. Every range in it is an estimate from operating experience and industry conversations, published to be stress-tested. It describes structure (which costs are earned and which are structural), not what any specific company charges.
Previously in this series: the 136% growth in 30+ day demand · where corporate housing came from · why aggregators don't solve insurance housing · why Radius goes direct to the inventory owner.
Book a 30+ day furnished stay, or list a property and reach insurance, corporate, and healthcare demand on one platform.

The Only Real-Time Marketplace Exclusively for 30+ Day Stays
© 2026 Radius. All rights reserved.
The only real-time marketplace exclusively for 30+ day stays.